Define a report data model

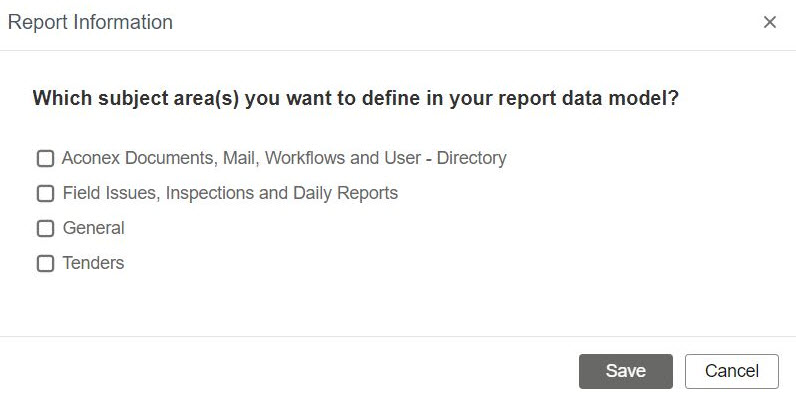
Create the data model for your custom report by choosing subject areas and relevant attributes.

Following our video series to create a custom report? You'll find the links for each step below.

Defining a Data Model is the first step required to create a custom report. In this article you’ll:

  • Select the main subject area(s) to include in your report, such as Mails, Workflows, or Tenders. (multiple subject areas can be selected)
  • Choose supporting subject area(s) where available.
  • Select fields/attributes such as Document Number, and Revision Date. 
  • Set report filters and customize column headings.

Create a Data Model

  1. From Insights > Reports, click Add Report at the top right of the page.
  2. Select the subject area(s) you want to define in your report data model. The Data Model Editor window will open.

Tip!

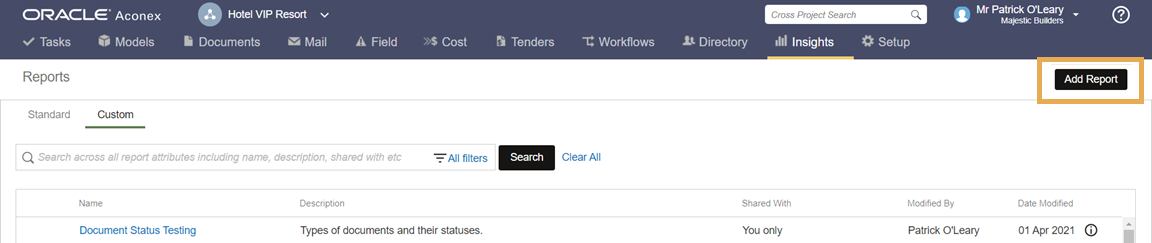
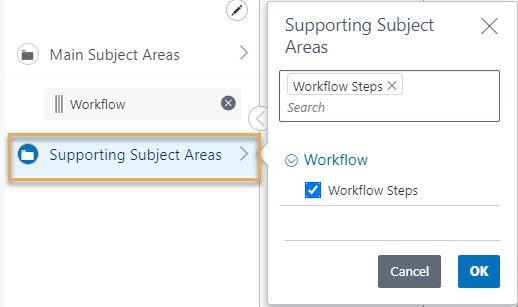
You can change the selected subject areas by selecting Edit data model from the three dots menu on the custom reports listing screen.

  1. Give your report a name and description using the pencil icons on the left panel.
  1. Click Main Subject Areas and select the subject areas to include in your report. Click OK.
     

Tip!

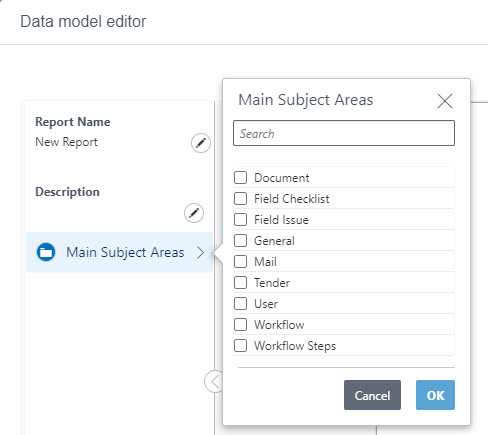
The Document subject area is selected by default, but you can de-select it.

  1. If applicable, select Supporting Subject Areas for your report.  
  1. You will see each subject area has been added to the main editor window. To the right of each subject area, there is a Filter icon and Add Columns button. 

    For each subject area, complete the following steps to add columns/attributes and customize filters:

    a. Click Add Columns.

Tip!

The Add Columns dialog box has two groups that categorize the attributes as

  • Dates (attributes pertaining to dates such as Sent Date for Mails or Due Date for Workflows)
  • General (all other attributes such as status for Workflows or Discipline for Documents)

View the full list of available Subject Areas and Attributes.

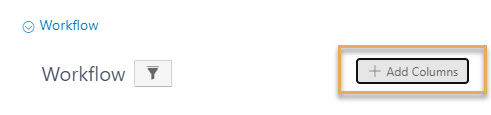
b. Click to expand the column groups, and select one or more columns/attributes to add.
Click OK when you are done. Each subject area must have at least one column/attribute added.

Tip!

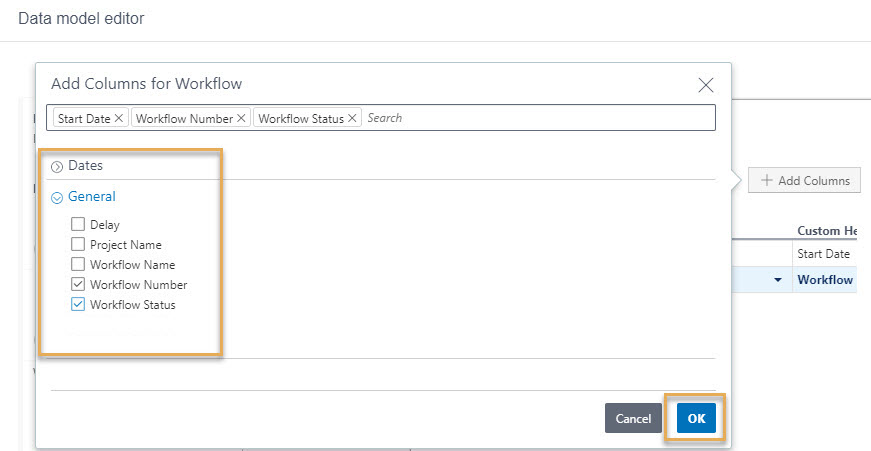
The model editor lists all available attributes in Aconex, even if they are not being used on your project. Please ensure you only select data that is available on your project, otherwise, your report may show empty cells or charts. 

c. If required, you can click into the Custom Heading column to create a custom title.

Tip!

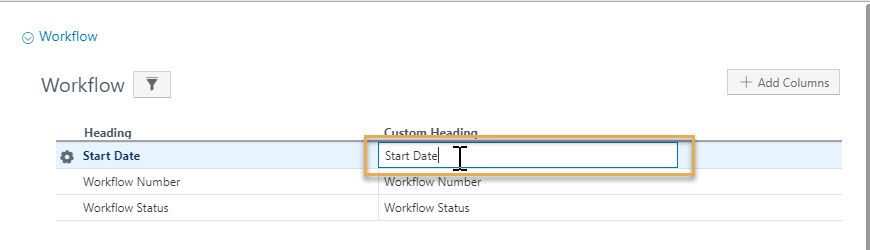
Note: Any custom headings you set here will not carry through to filtering. This means when you set your filters in the next step, the attributes will be listed by their original heading.

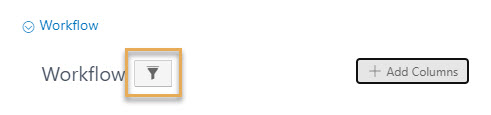
d. Click the Filters icon.

e. Configure your filters as required using the dropdowns.

  • Select a Field to be used as a filter attribute.
  • Choose an Operator for the filter.
  • Select a Value for the filter.
  • You can select multiple values using Shift button + <up/down arrow key>
  • Select Prompt at run to allow filter values to be changed when running the report. This option must be enabled on the main subject area before it can be enabled on a supporting subject area.
  • When you have added all required filters, click Apply

Tip!

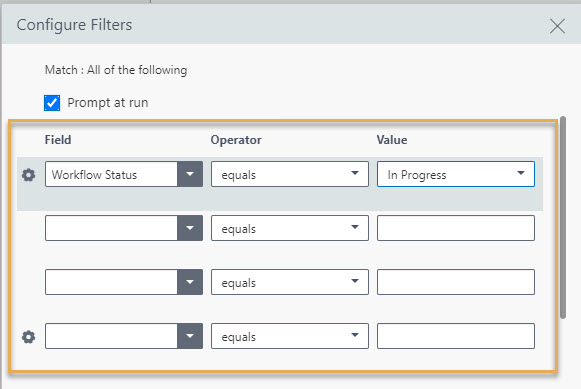
Add more filter rows by clicking the gear icon.

  1. After adding columns for all subject areas, editing column headings and setting your filters click Save to save your Data Model. 
  2. Click the X button to close the Data model editor window.  
  3. Your new report will be available in the Custom tab, but you still need to add a Layout in order to view it.

Whats Next? You’ve selected the data for your report, next you need to design a layout to display it. You have two options:

          or