Support Central
You use distribution curves to show budget and forecast data over time.
Aconex Connected Cost provides you with the ability to create distribution curves that are used to spread budget and forecast data over time. Distribution curves can be created at the organization level, allowing all projects to use the same curves. Distribution curves can also be created for a specific project based on unique project requirements.
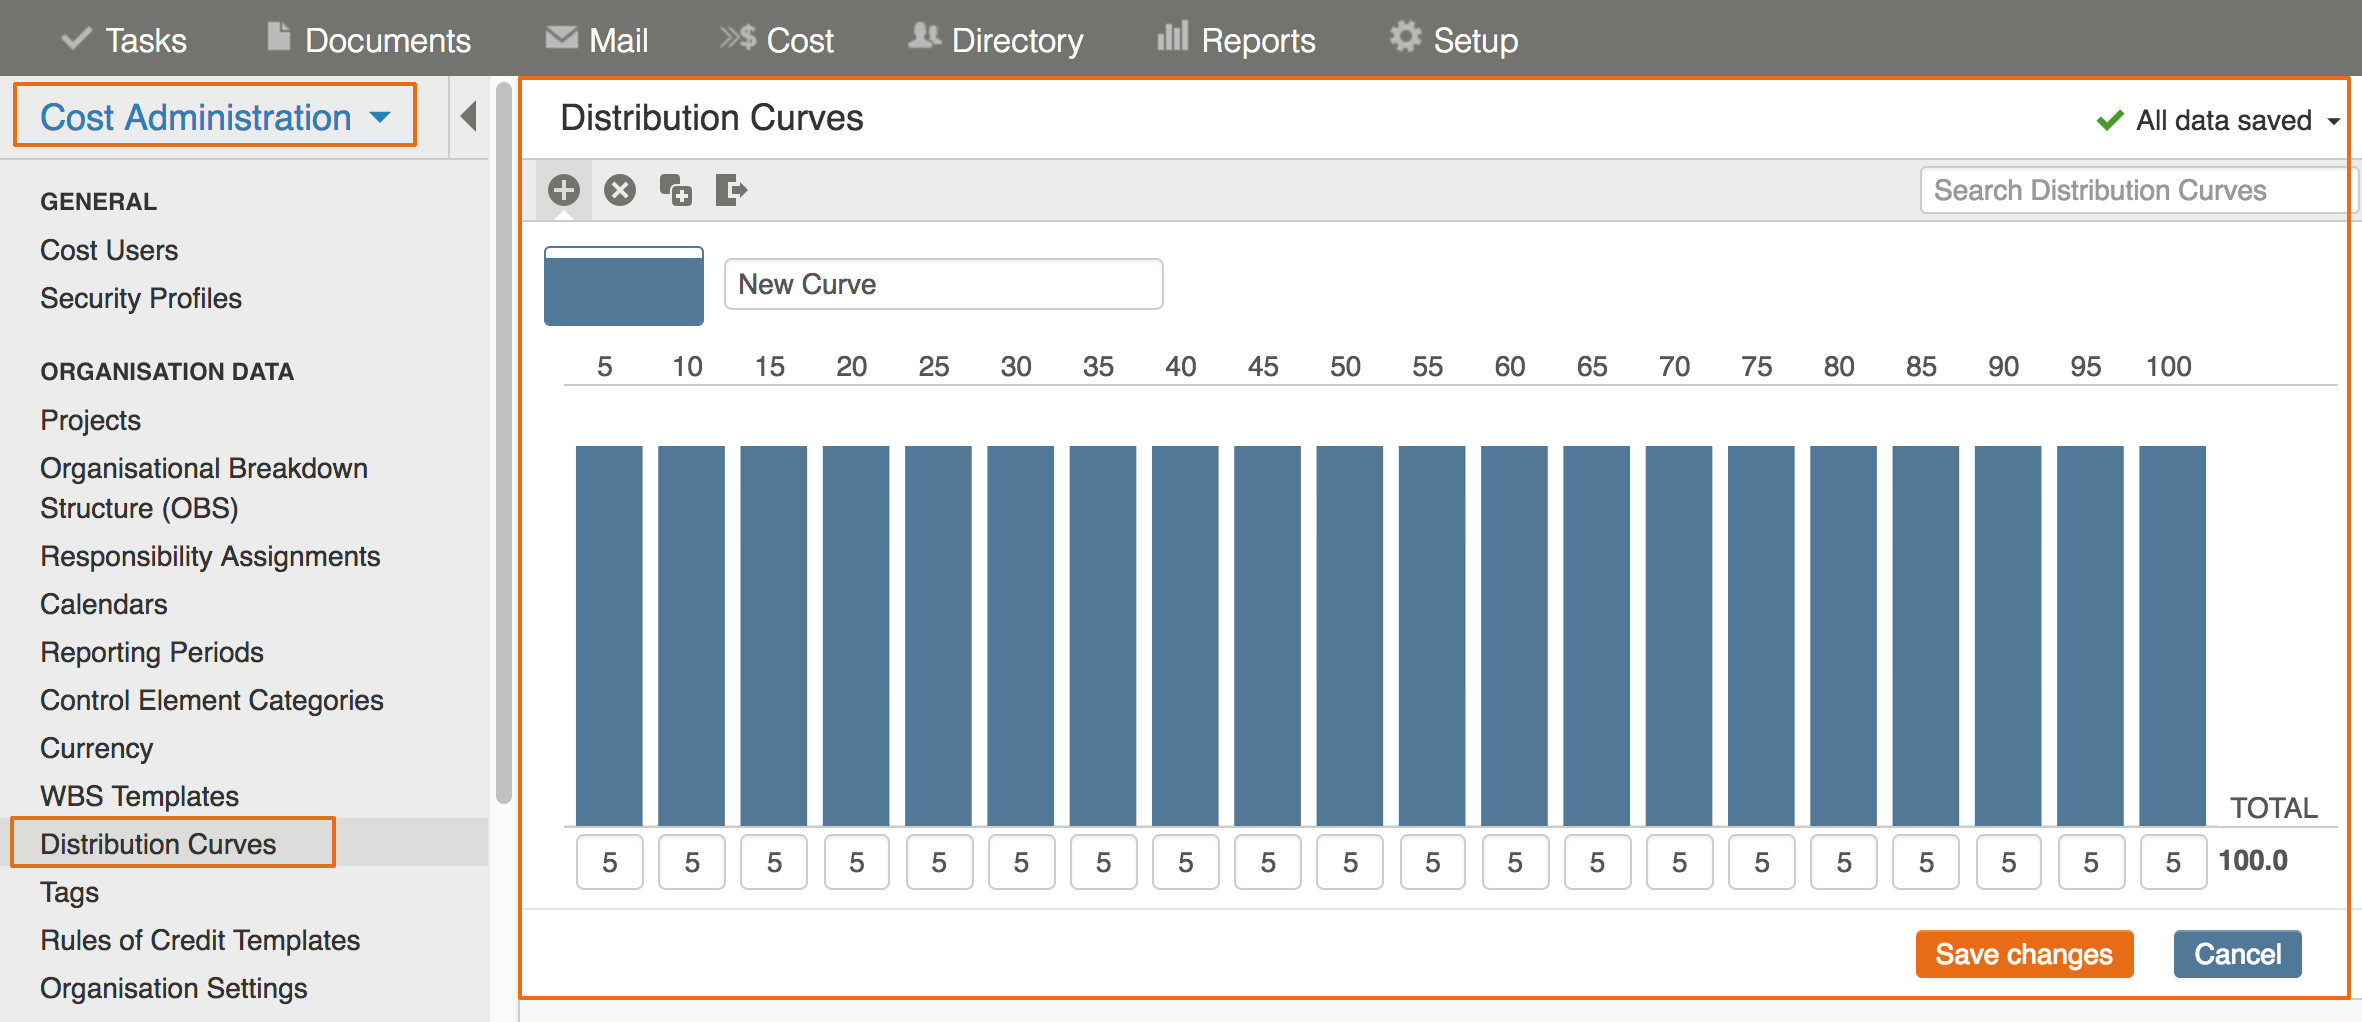
For organization level distribution curves (standard curves that can be used on all projects), select Administration/Organization Data/Distribution Curves. For project specific distribution curves, select Administration/Project Data/Distribution Curves.
Click the Add icon on the toolbar.
Click in the New Curve cell and enter the name for the new distribution curve.
For each segment, click in the cell and enter a weight for the segment. The total weighting must equal 100 to save the new distribution curve.
Click Save Changes.
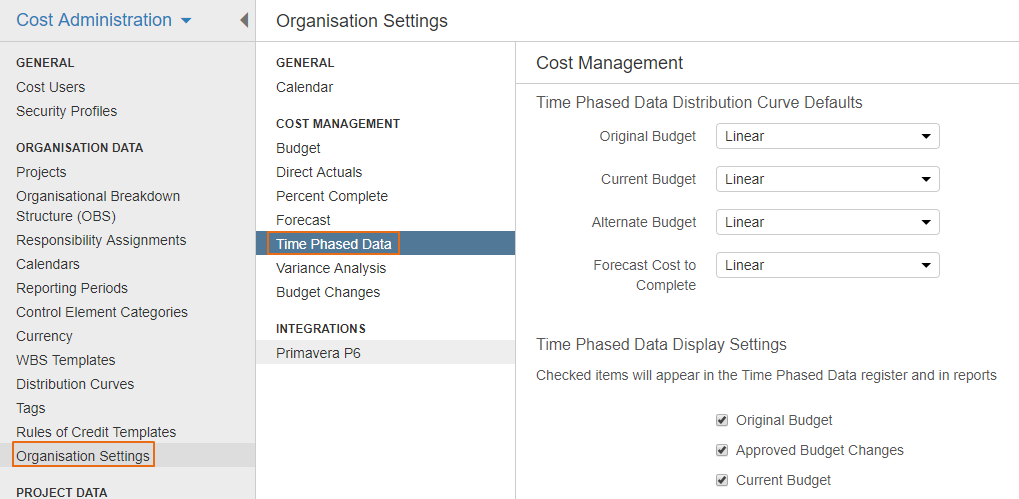
To define organization level distribution curves (standard curves that can be used on all projects), select Administration > Organization Data > Organization Settings > Time Phased Data. To define project specific default distribution curves, select Administration > Project Data > Project Settings > Time Phased Data.