Support Central
Let Cost calculate time phased data for your projects
Cost can calculate time phase data and produce time based metrics and reports, but requires a few things to be in place before the calculations will work correctly.
Time phased data requires four things in order to calculate:
Calendars and reporting periods are defined for the entire project, while distribution curves and schedule activities link to control accounts on the cost worksheet.
Once the project has been prepared, time phased data needs to be calculated using a utility.
Calendars define the work days per week, hours worked per day, and any holiday / non-working days in the year. You can account for weekends by setting the days to 0 hours per day, but holiday periods must be specified for each year in the calendar.
Calendars can be defined at either the Organization or Project level. Each project links to one calendar which affects all the time phased data on the project.
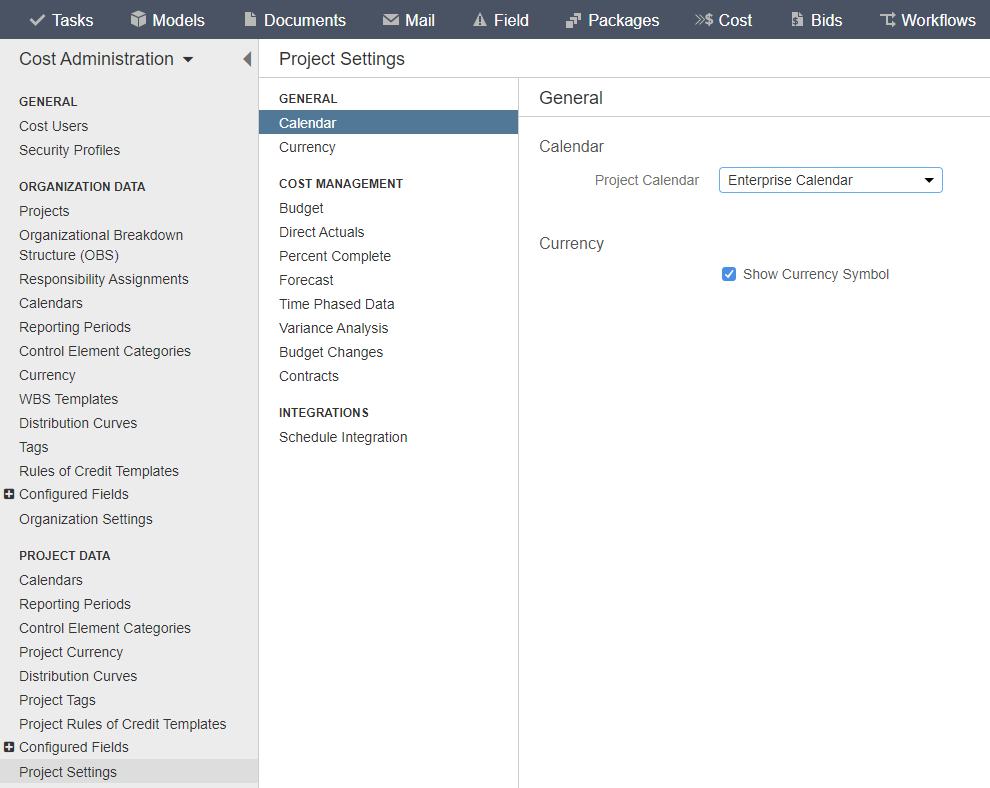
Once calendars have been setup, you specify the Calendar to use under Cost Administration > Project Settings > Calendar
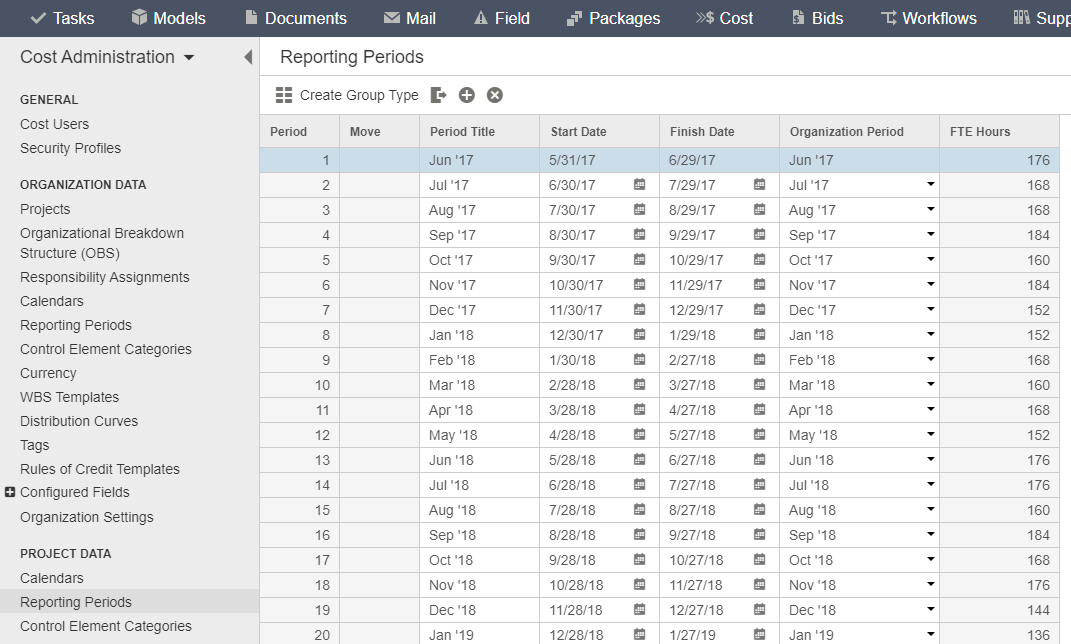
Reporting periods represent the reporting cycle the project will go through. Typically, projects report on a monthly basis, so reporting periods should be setup for each month. It’s possible to have weekly or custom reporting periods if required.
Time phased data is calculated per-reporting period using the calendar, distribution curve, and dates.
Reporting periods are typically setup when a project is enabled for Cost, but can be modified later under Cost Administration > Project Data > Reporting Periods
Distribution curves define how budgets and forecasts will be spread over the reporting periods, within the start & finish dates of the control account.
Distribution curves can be defined at the organization or project level but are assigned at the control account or control element level in the cost worksheet.
Read our guide on creating distribution curves.
Changing the distribution curve on a control account will update all assigned control elements.
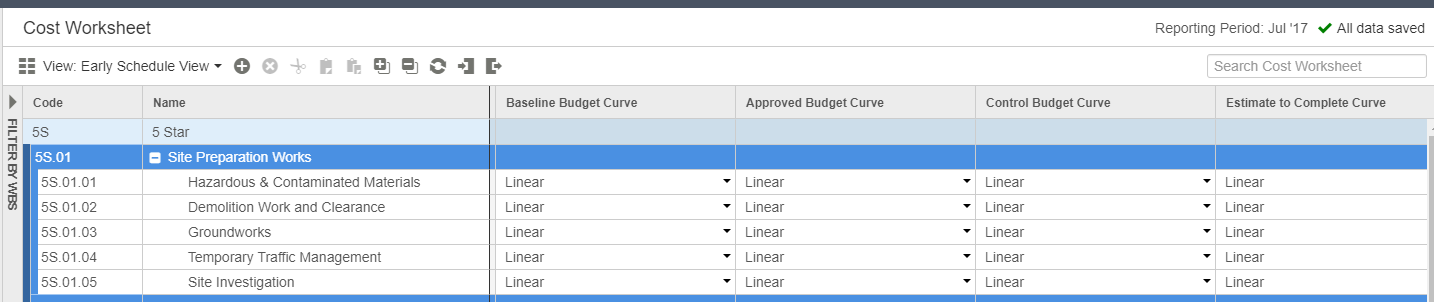
To select the distribution curves at the control account or control element level, go to the cost worksheet, and enable the four columns (note these reflect the US English terminology, other languages have different names):
The three budget curves affect how the budget is spread over the project’s reporting periods, while the estimate to complete curve is used to spread the estimate to complete over future periods.
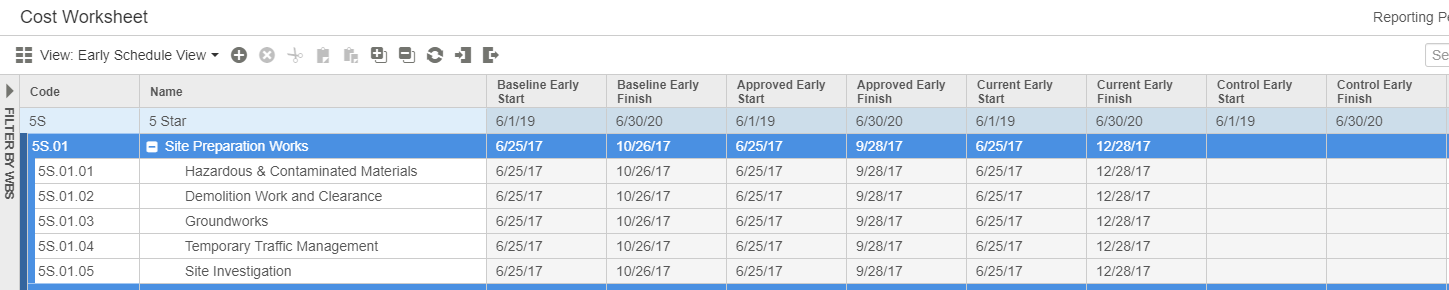
Each control account must have start & finish dates associated in order to calculate time phased data. There are multiple pairs of start & finish dates at the control account level which tie to the 4 curve types listed above, plus early and late dates. You don’t need to define all the dates for time phased data.
As a minimum you should have dates for:
These three pairs of dates relate to the first three curves listed above.
Dates can be entered manually for each control account on the cost worksheet, or by using schedule activities and linking them to control accounts.
Schedule activities are generally easier and quicker to create and maintain, especially if multiple control accounts have the same start and finish dates.
You can have many control accounts linked to a single schedule activity, but you can also have multiple schedule activities linked to a single control account if required.
Read our guide on schedule activities
Once the steps above have been completed, you can use the spread time phased data utility to calculate TPD.
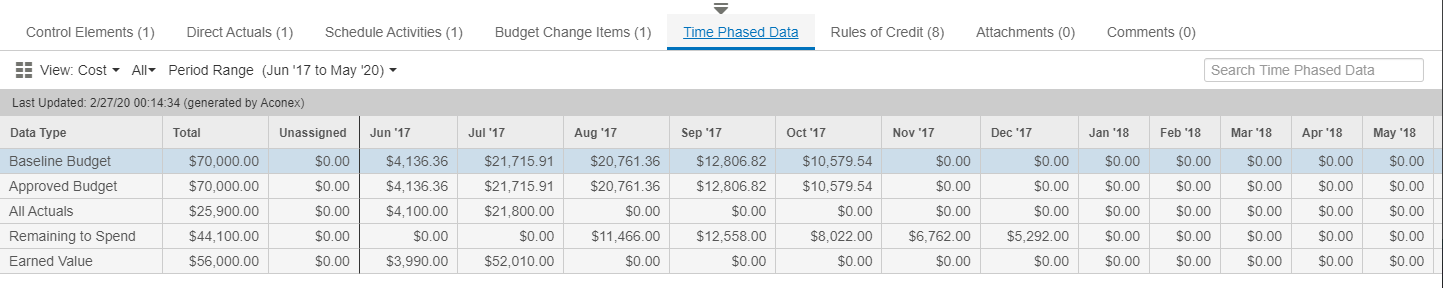
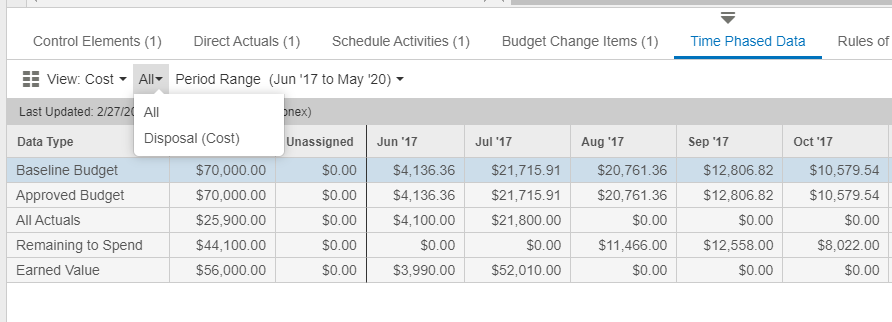
Once the utility has calculated the time phased data, you can view the result in the lower grid on the cost worksheet by selecting a control account, and choosing the Time Phased Data tab.
Time phased data can also be displayed on a report under Cost Reports > Time Phased Data. You may need to create a new report if you don’t already have one setup.
Project Settings
You can control some of the time phased data behavior in Cost Administration > Project Settings.
The two relevant sections are:
Closing Reporting Periods
Time phased data relies on reporting periods to be closed at the end of each cycle. Closing a reporting period “locks in” the budget time phased data and actual costs for that period.
Read our guide on closing reporting periods.
Manually Editing Time Phased Data
You can manually edit the calculated time phased data by following these steps:
Time phased data is calculated at the control element level, so you may need to edit multiple control elements on each control account.
Some fields cannot be edited such as the budget fields from closed reporting periods, all actuals, and earned value. All actuals and earned value are calculated based on other data in Cost, so you need to edit the related records instead of directly editing the time phased data.
Importing Time Phased Data
Time phased data can be imported using the import time phased data utility. We recommend you calculate time phased data first, export the calculated data and use the file as a template to make adjustments.
Read our guide to importing time phased data.


