Support Central
Design your report offline using the BI Publisher plugin for Microsoft Office.
Following our video series to create a custom report? You'll find the links for each step below.
Use the Oracle BI Publisher plugin in Microsoft Word or Excel to create a customized layout for your report. The plugin allows users who are familiar with either Word or Excel to easily produce a report layout for importing into Aconex. Advanced users can also use XSL or SQL code for creating attributes based on customized logic.
Before you begin:
The plugin only supports Microsoft Office for Windows computers. If you are unable to use the plugin, you’ll need to use the online editor to design your layout.
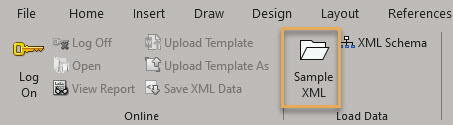
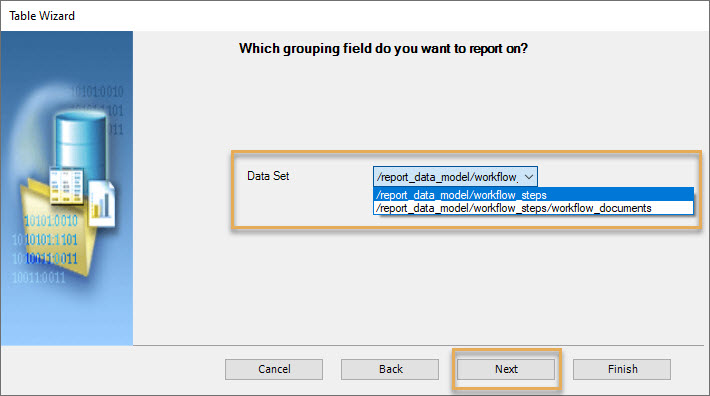
First, you need some data to work with. To do this you’ll export the Data Model from Aconex, and import it into the BI Publisher template builder.
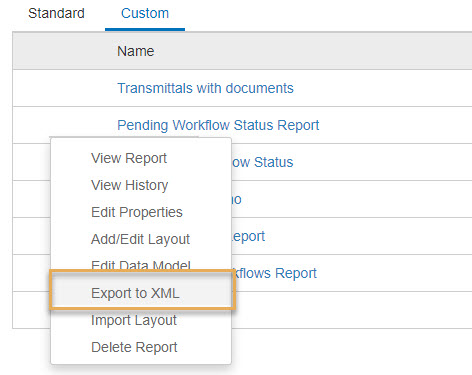
Layouts designed in the online editor cannot be exported or used in the plugin. Similarly, layouts created with the plugin cannot be modified in the online editor.
Export to XML shows the subject area metadata only when there’s data to be retrieved in the respective module.
For example, there are documents in the document register, but none of them are attached in workflows.
For a data model created with Document as main subject area and Document Workflow Steps as the supporting subject area, the exported XML file will show the Document subject area metadata but not the Document Workflow Steps metadata.
Once a doc is attached in any workflow then the exported XML will return the workflow step metadata as well along with Doc metadata.
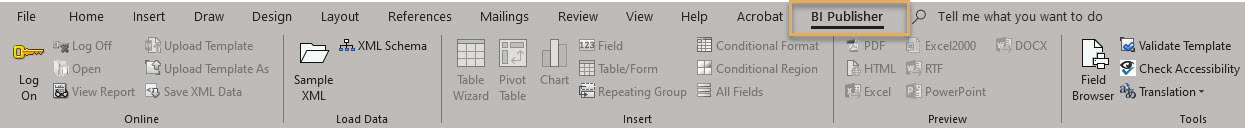
The BI Publisher plugin can also be used in Microsoft Excel, but we recommend using Word.
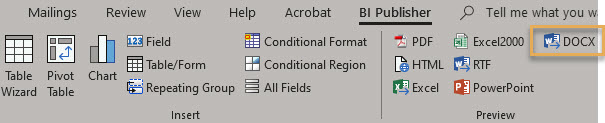
Now the icons in the Insert panel (that were previously greyed out) are now available to use. We can begin building the layout for our report.
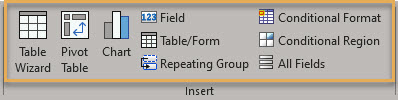
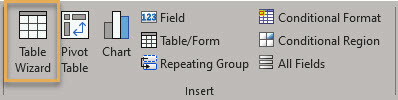
Make sure you use the insert options within the BI Publisher tab. If you insert a regular table using the standard Word formatting options, your layout will fail to import into Aconex.
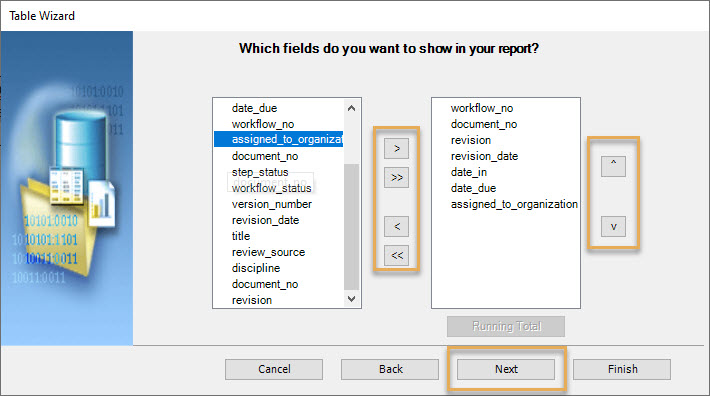
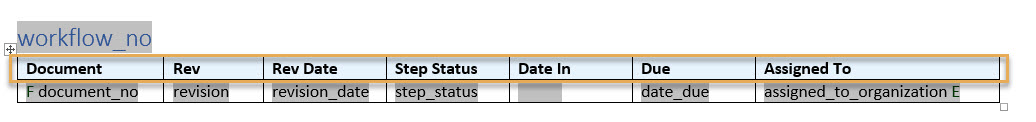
Your table should look similar to the example below.
The top row of the table contains the column headings, and in the second row, are the data fields (attributes) that will display down the page.
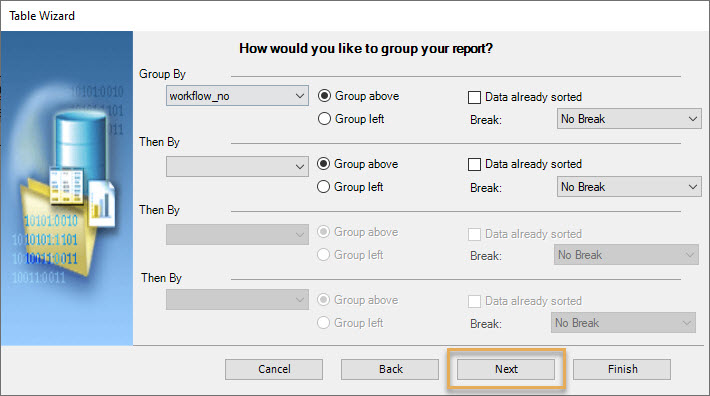
This example is grouped by Workflow No.
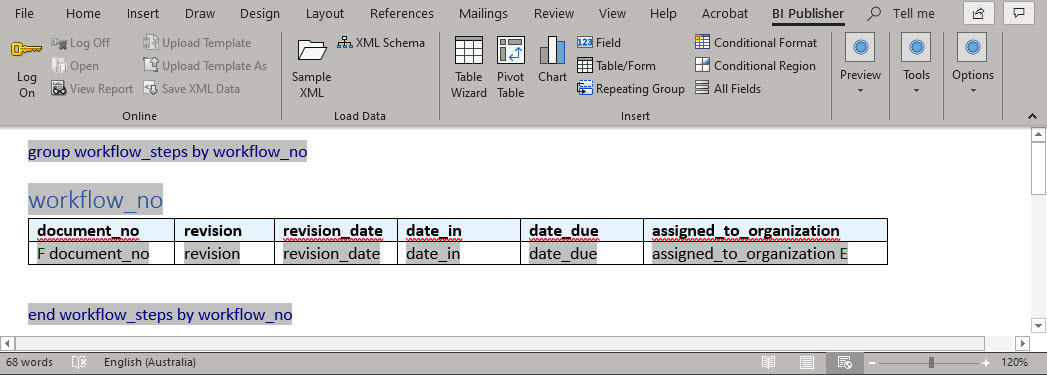
You may see an F character on the far left, and an E on the far right of your table. These are special fields that allow the template to import into Aconex. Make sure you leave these in position whenever you modify your table layout.
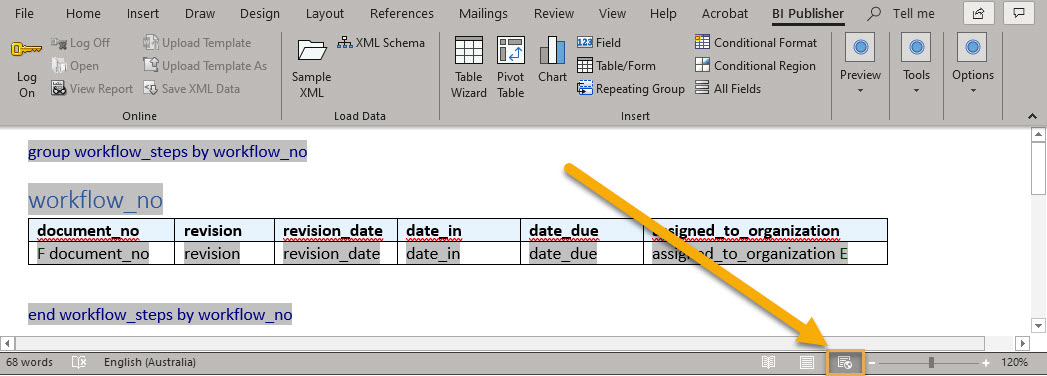
Use the standard Word formatting tools to adjust the look of your table (such as font, alignment, and color). If your table is too large to fit the page width, you can click the Web Layout view and scroll to view the table as needed.
Now is a good time to preview your table, to get an idea of how it will display. In the Preview panel, click DOCX to preview in Word.
Save your layout as an RTF file when prompted. Make sure you give the file an appropriate name and save it in a safe location. This filename will be the name of the layout, once it’s imported into Aconex.
Now, we can make some adjustments to the layout. Edit headings, add columns, format data fields, and apply custom formulas (advanced users).
Edit column headers
Click into a heading cell and change its name to suit your requirements.
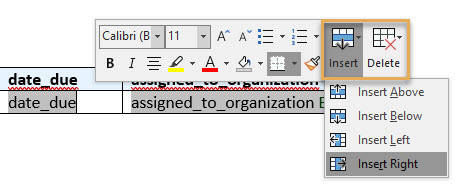
Add or Remove columns
Right-click your table and select either Insert or Delete to add or remove columns.
Add data columns
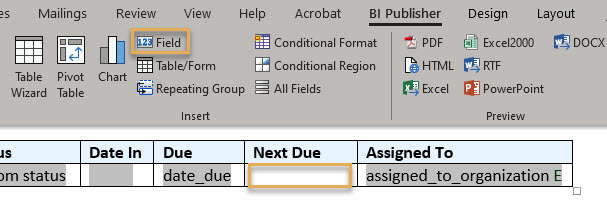
Click into a newly added cell and select Field from the top Inset menu. Select a data field and click Insert.
Format data fields
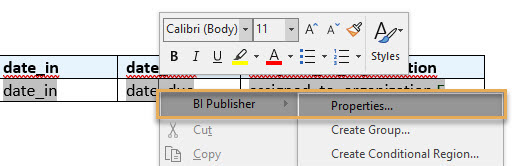
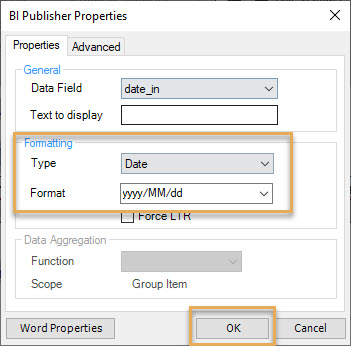
Right-click on a data field and select BI Publisher > Properties. For example, you may want to format all date fields to ‘YYYY/MM/dd’.
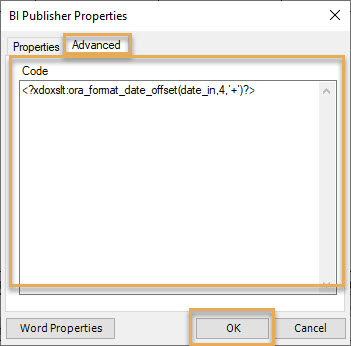
Optional: Insert a custom calculated field
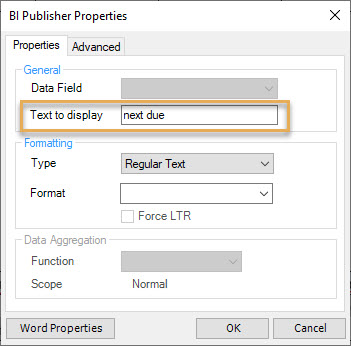
Advanced users can use SQL or XSL code to create custom fields in your report layouts. In this example, we’ll create a custom field named ‘Next Due’ that adds four days onto the date_in field.
To achieve this, we first need to insert any data Field. Then we’ll repurpose it as a ‘Next Due’ field with custom code.
Looking for more formulas? See Apply advanced functions in the offline template builder.
Once you’re happy with the look of your template, make sure you Save, and then take another peek using the Preview option.
Make sure you save as a .RTF file.
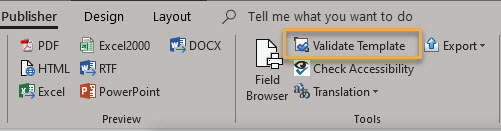
Validate your template to check for errors. ‘No error found’ means your template file should successfully import into Aconex.
Now, in Aconex, select your saved report and choose Import Layout from the ellipsis menu. Select your saved .rtf template file and you’ll receive confirmation that your layout was imported successfully.

If you’ve previously imported this layout into Aconex, you’ll first need to delete the older version in Aconex before you import the updated one. Layouts can be deleted using the Add/Edit Layout option.
When saving the .RTF layout template do not use special characters in the file name.
Aconex doesn’t support importing .RTF layouts with special characters in the file name (e.g. RFI_sent&received.rtf). Make sure you avoid special characters or you’ll get an ‘unable to import layout’ error message.
Click on the report title to view and share your new report.


