Support Central
Choose from various layout components when creating your custom report layout
Before you begin
The Offline Template Builder contains all the same elements as the online editor, available from the Insert panel. Standard word elements such as text, formatting, and images can also be used.
Chart
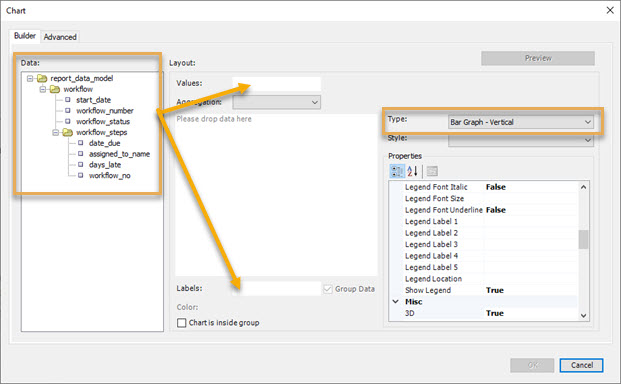
BI Publisher does not support native Microsoft Word charts. You need to create charts using the Template Builder only.
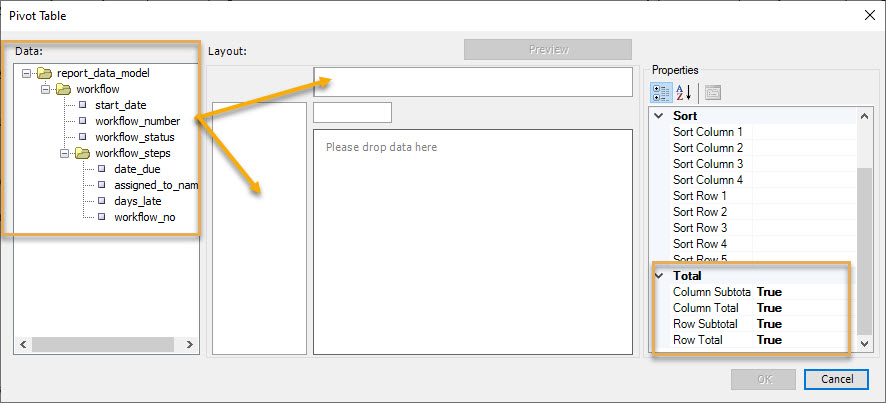
Pivot Table
What other features are available in the BI Publisher Template Builder?
In addition to the Tables, Pivot Tables, Conditional formatting, and Charts, the following features are available:
| Component | Description |
|---|---|
| Field | Allows you to select fields from your data source and insert them into your template. |
| Table/Form | Insert data fields to be organized as a simple or nested table or as a form that is repeated with different data. Organize data fields for the whole document before inserting them. |
| Repeating Group | Select or define a group of elements to be repeated for each occurrence of an element in the data. |
| Conditional Region | Insert a conditional statement around a region of the template. A conditional region is an area that is surrounded by a conditional statement. If the statement tests true, the area is displayed in the report; if the condition tests false, the area is hidden from the report. |
| All Fields | Inserts all fields found in the XML data into your document. It will also insert processing instructions into your document that will repeat a section, such as a table row when the associated XML element is repeated. (When you are working on a deeply nested hierarchy of elements, it is better to insert elements separately, instead of inserting all fields) |


