Support Central
Choose from various layout components when creating your custom report layout
Before you begin
The components available from the Insert tab are:
| Component | Description |
|---|---|
| Layout Grid | Used to align components properly in the layout/canvas. All other components should be dropped into a layout grid for best alignment. |
| Chart | Drop visual charts, such as Bar, Line, and Pie into your layout grids. Format the chart from the Chart tab and Properties pane. |
| Page Elements | Insert page numbering, page break, and total page count. To align these properly, drop them into a Layout Grid, then drag the corresponding Layout Grid cell to the required position on the page. |
| Text Item | Display custom text for headers, notes, and short descriptions. Select the Layout Grid cell to which the Text Item component is to be added, then drag and drop the Text Item component. |
| Image | First add a Layout Grid component from the Insert menu to align the image properly in the design area. Then drag & drop the Image component into the Layout Grid. Choose the image stored on your computer to insert. |
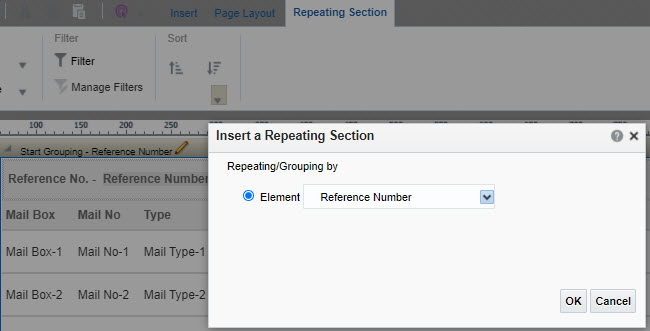
| Repeating Section | Allow you to repeat a similar set of components (charts or tables) for every value of an attribute. For example, you could create a mail status bar chart for each mail type by grouping by element ‘Mail Type’. Use the Properties pane on the left panel for more formatting options. |
| Table | Drag and drop a table into a layout grid. To add columns in the table, drag & drop the data fields from the ‘Data Source panel on the left. Increase or decrease the column width by dragging them with your mouse, or select the cell or column from the table, go to the Appearance section under the Properties pane adjust the Width option. The Properties section contains many other formatting options such as alternate row colour, no. of rows to display and padding. You can apply conditional formatting to the table using the Highlight option. |
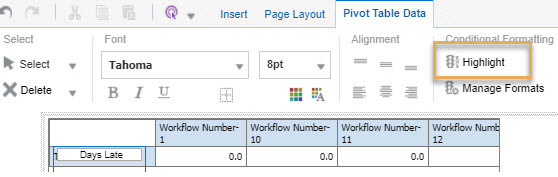
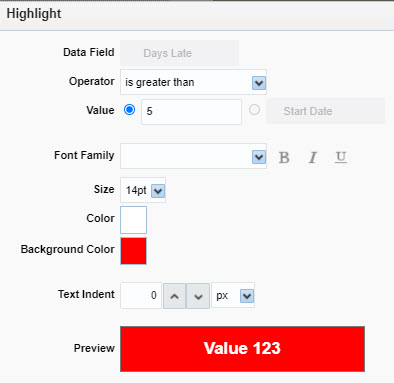
| Pivot Table | Drag and drop a pivot table into a layout grid cell. Then drag and drop data fields from the Data Source panel on the left. Open the Properties pane for more formatting options. Apply conditional formatting on the pivot table using the Highlight option in the Pivot Table Data pane (display this by clicking on your pivot table data). For example you may want to show a red background to highlight workflows that are over 5 days overdue. |
Repeating Section example:
Pivot Table with Conditional Formatting example: