Create a custom report using the new report editor

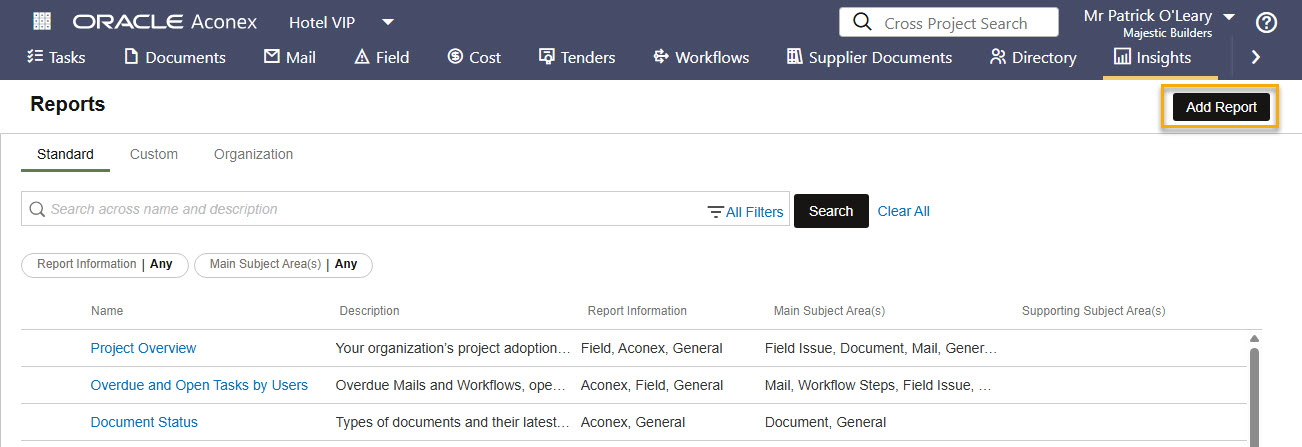
Use the new report editor to create a custom report in one flow.

Thanks to your feedback we've streamlined the report creation process, so it's much easier to create the report you need. You no longer need to separately set up a data model and layout. It's all configured together in the new editor. 


Key benefits of the new report editor:

  • Select the columns, filters and layout for your report all in one flow.
  • Once a main subject area is selected, columns from related supporting subject areas are automatically available for selection. You no longer need to explicitly select supporting subject areas.
  • Report across modules, such as Mail, Documents and Workflows.
  • Your report will display data for the main subject area even if the supporting subject area doesn't have any data. For example, a report created with Mails as the main subject area and Attached Documents as a supporting subject area will include mails without any attachments. 
  • Preview the report before you save it.
  • Reports created using the new editor are optimized for Excel output.


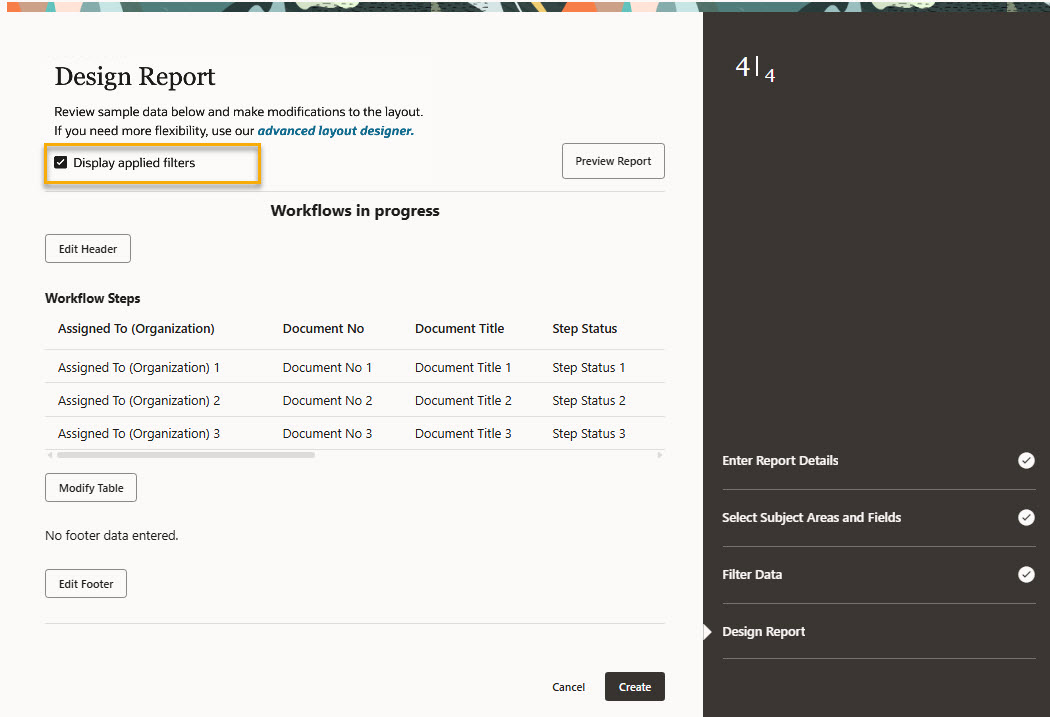
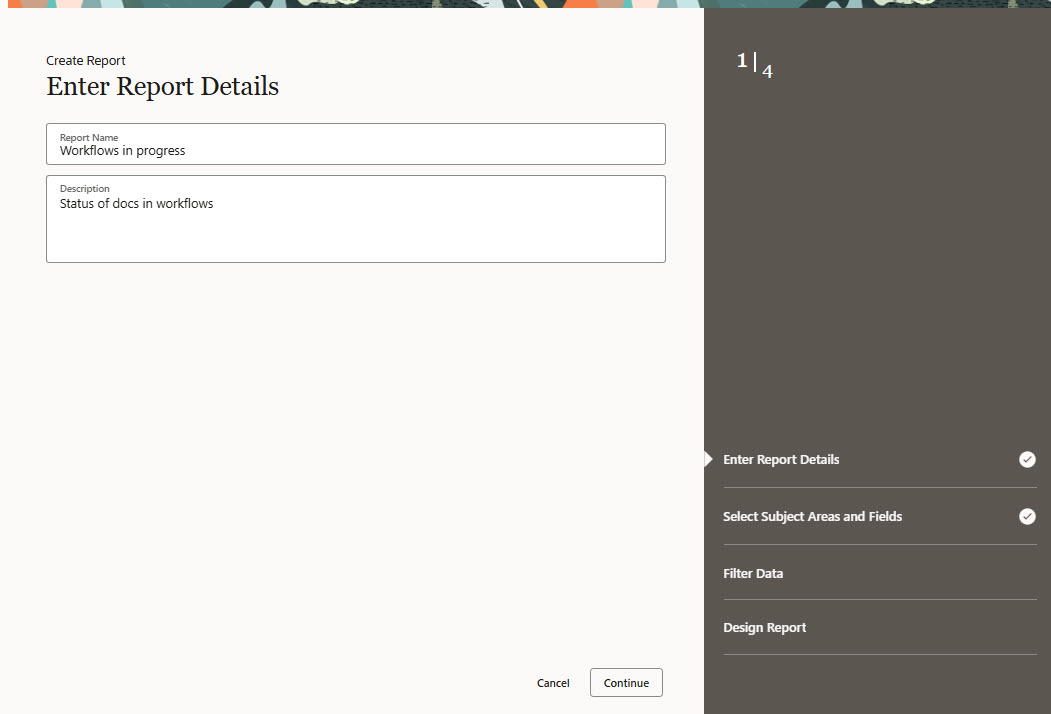
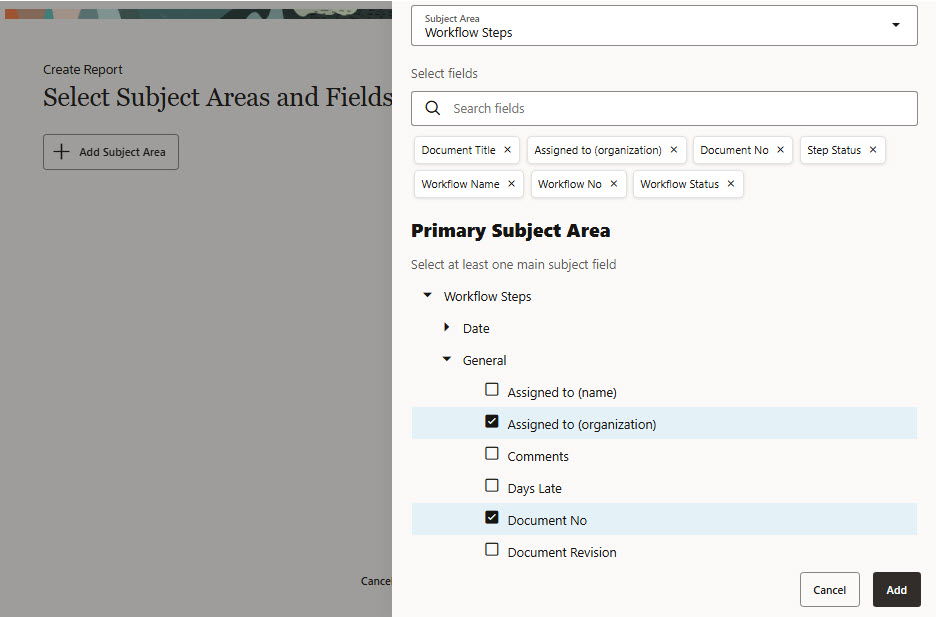
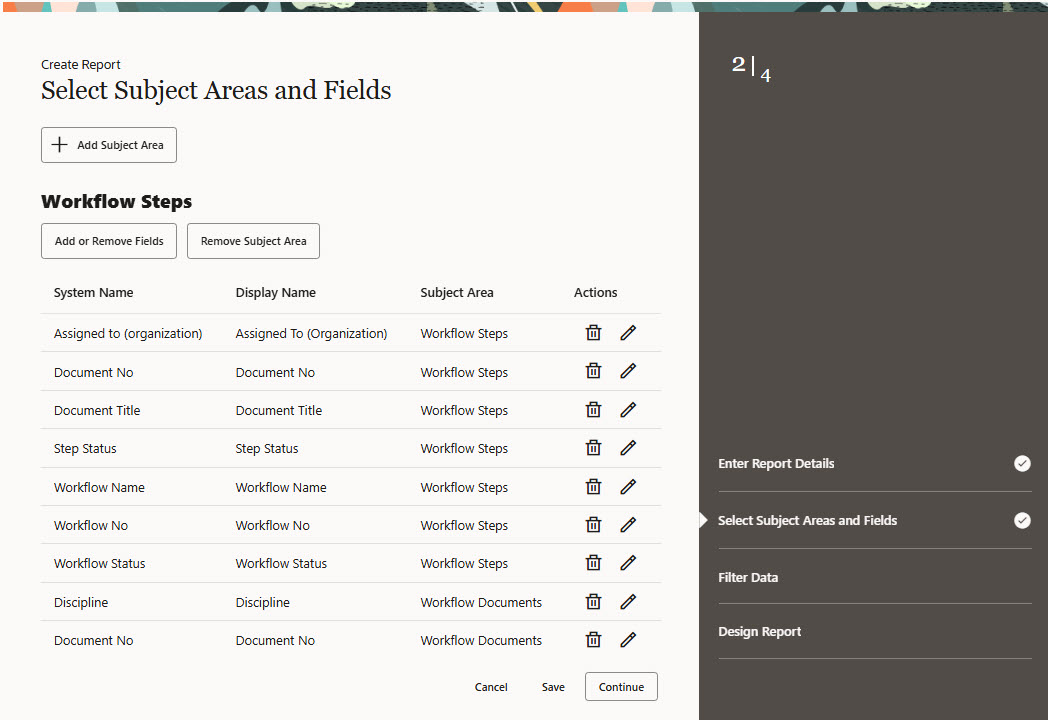
Create a report in four steps:
As you complete each step you'll see your progress on the right. At any time during the report creation process you can click the links to go back to a previous step.

  1. Enter report details.
  2. Select subject areas and fields.
  3. Filter data.
  4. Design report.

Open the report editor

  1. From the main navigation click Insights then click Reports.
  2. Click Add Report.
  1. Choose the modules or features you want to report on and click Save.

Enter report details

  1. Enter a name and description for your reportThis helps you and others know what the report is for when you run or schedule it.
  2. Click Continue.

Select subject areas and fields

  1. Choose the primary subject area. This is the main module or feature in Aconex you want to report on. For example if you want a report of overdue workflows, you would choose Workflow Steps. 
  1. Choose the fields for your report from the primary and supporting subject area.
  • These are the columns that will appear in your report such as the document number, workflow status, and assignee.
  • You can search for a field from both the main and supporting subject areas
  • Click to expand the arrows to see the available fields.
  • You must choose at least one field from the primary subject area.
  1. Click Add. You can review your choices and add more modules or columns on the next screen.
  2. You'll see your chosen modules and columns. From here you can:
  • Add another module to the report by clicking Add Subject Area.
  • Add or remove columns by clicking Add or Remove Fields.
  • Remove a module from the report by clicking Remove Subject Area.
  • If available, click Settings to include historical data.
  • Edit a column heading by clicking the pencil icon under Actions.
  • Remove a column by clicking the delete icon.
  1. Click Continue when you're ready to move onto the next step.

Filter data

  1. Click Add Filter to filter your report on specific data. You can select columns from both the main and supporting subject areas in the dropdown list.
    For example you may only want to see workflows that are in progress. Filtering also helps the report load faster.
  2. Click Continue.

Tip!

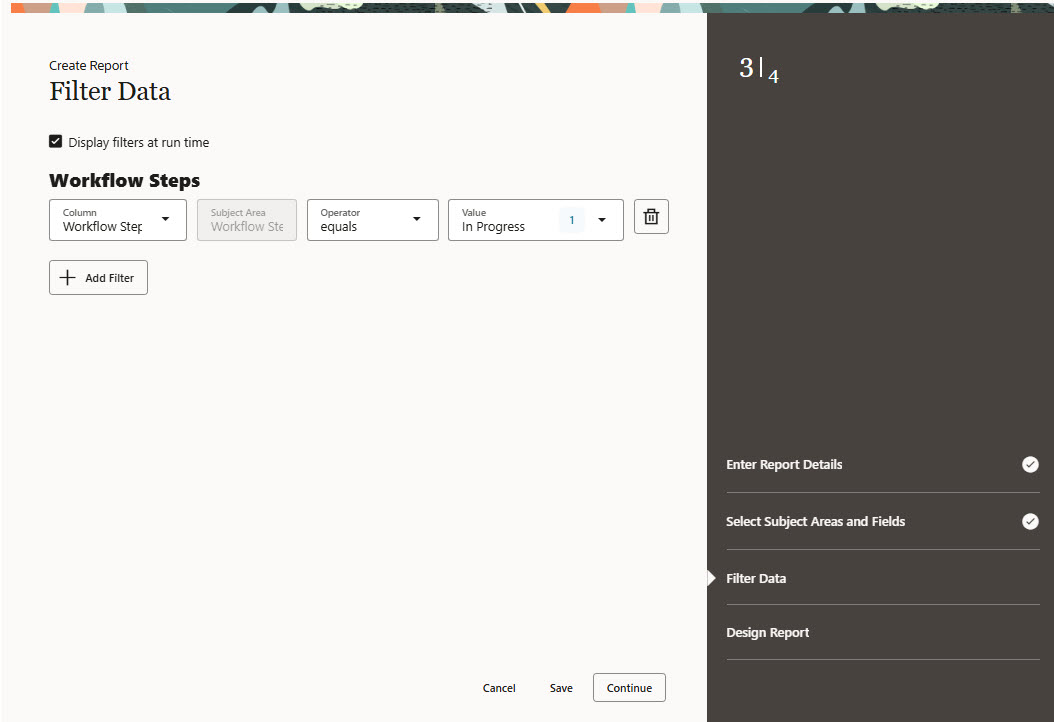
Select Display filters at run time to allow filter values to be changed when running the report.

Design report

  1. You'll see the layout for your report. There is a table for each primary subject area (or module) you are reporting on. For each table you can change the column ordering, sorting and grouping. You can also add text and images to the header and footer of the report.
  2. To include the list of filters you used at the bottom of the exported report, check Display applied filters. This helps others who view the exported report to understand which filters were applied.
  1. Click Preview Report to get an idea of how your report will look. You'll see a sample of up to 25 records per table. The preview will open in a new tab and look similar to the below image.
  1. Click Modify table to customize the ordering, sorting and grouping of the columns in the report. 

    You can:
  • Change the heading for the table.
  • Set the decimal places for numeric fields and date format.
  • Choose columns to sort by. Columns are sorted in the order that they appear on the report and not by the selected order.
  • Choose columns to group by. Grouped columns appear on the left of your report in the order they are selected.
  • Change the ordering of the remaining columns. Under the ungrouped fields heading click to select a column, then drag and drop it to the required position.
  1. After making your changes, click Apply.
  1. Click Edit Header to add a header. You can add an image, text or variable to the left, middle or right position. The same options are available for the footer.
  2. Click Apply.
  1. Click Create when you are ready to save your report.
  2. (Optional) The report editor suits most users, however advanced users have the option to use the advanced editor to create more advanced layouts. If you want to do this click advanced layout designer then follow the steps to create a layout using the advanced editor.
  3. Your new report is ready to run from the Custom tab on the reports screen.
  4. To edit your report click the three dots menu and choose Edit Report. If you want to use the advanced editor, choose Add/Edit BIP layout.