Support Central
Get easy-to-understand visualizations of process information to diagnose risks and performance.
A construction manager on the ACX@Training & Practice project wants to identify process bottlenecks and close them out.
Specifically, they want to know:
First, we'll need to set the appropriate filters:
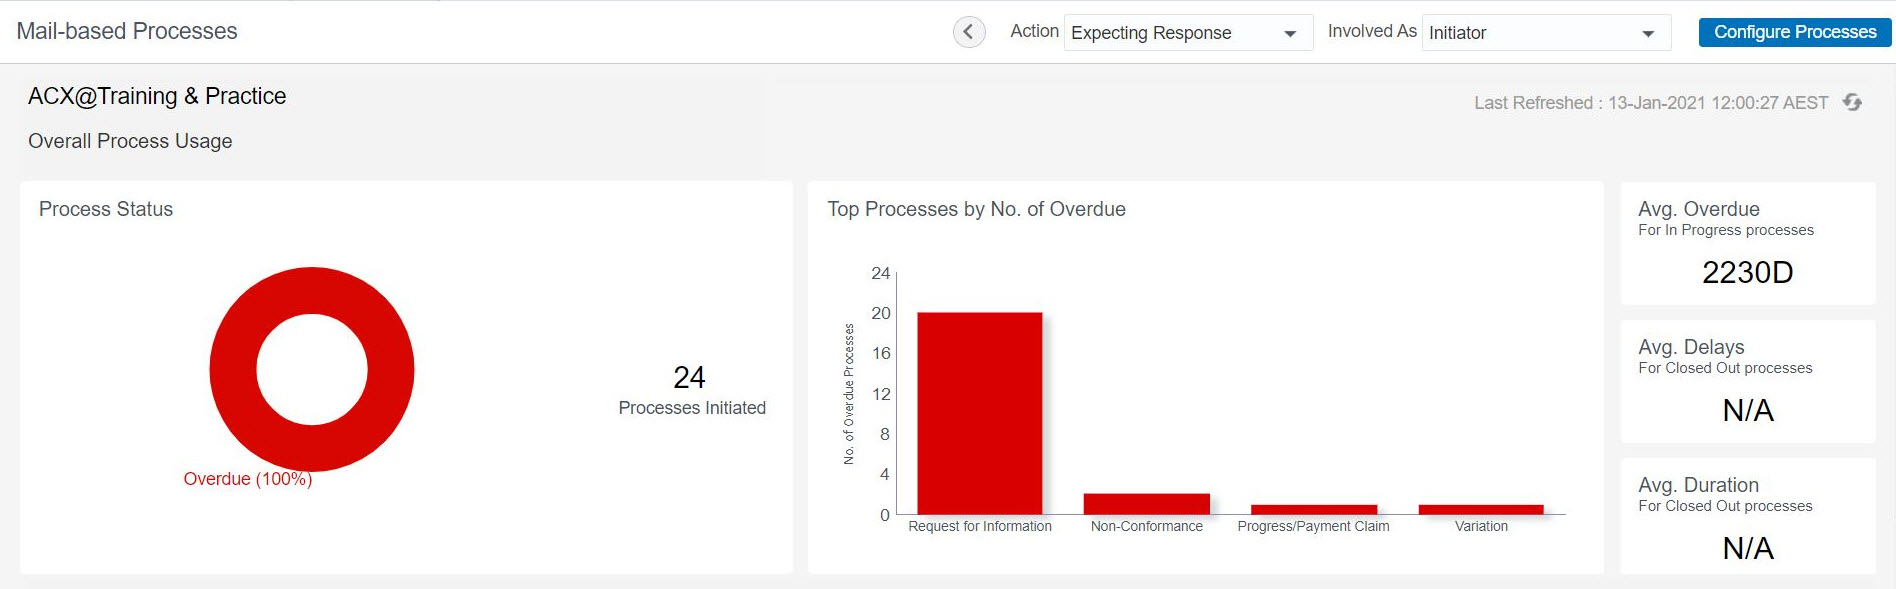
Select the value Expecting response from the Action filter.
Select the value Initiator from the Involved As filter.
We can see the details of processes initiated by the construction manager. Of 24 total processes that were initiated, all are overdue. Of these overdue processes, the bar chart shows the top overdue processes by name.
We can see the following processes are overdue. :
The average overdue across all 24 processes is 2230 days.
Let's get more details on those RFI processes.
We'll select Request for Information from the process selector.
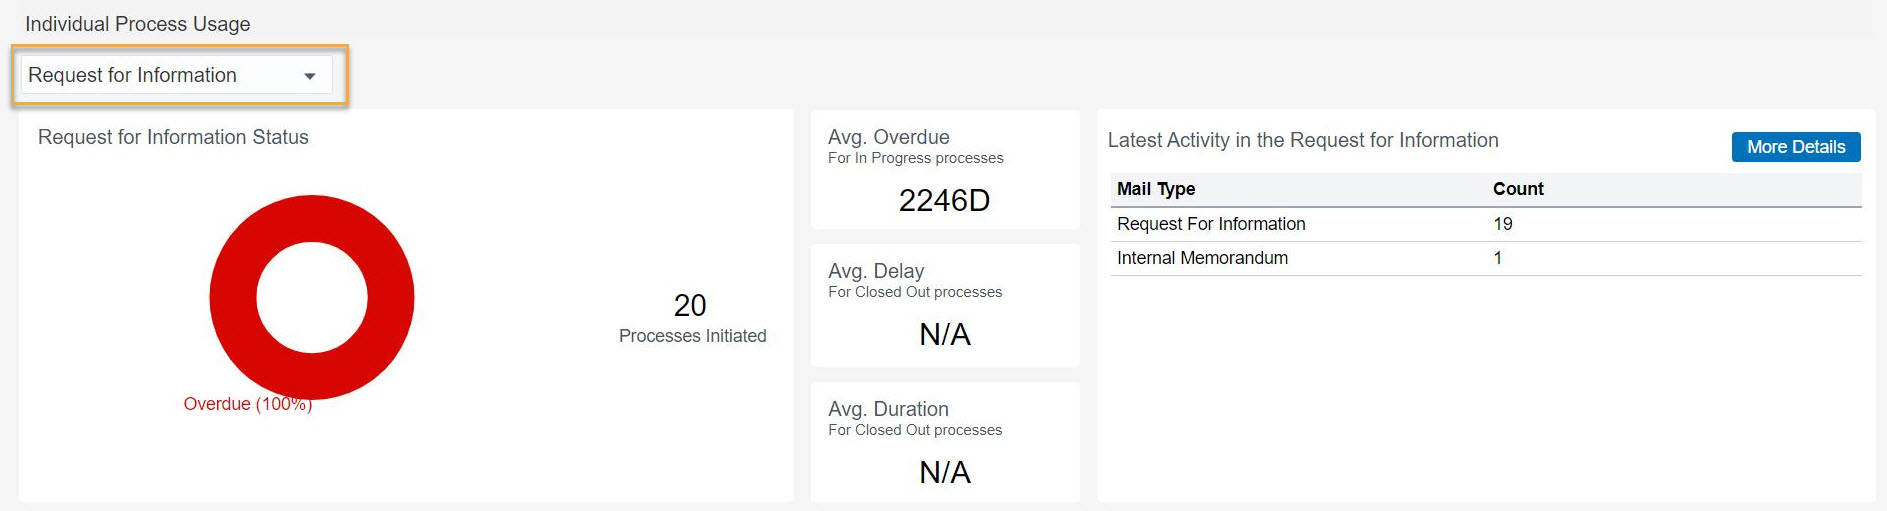
The donut chart shows the status of all RFI's. They are all overdue.
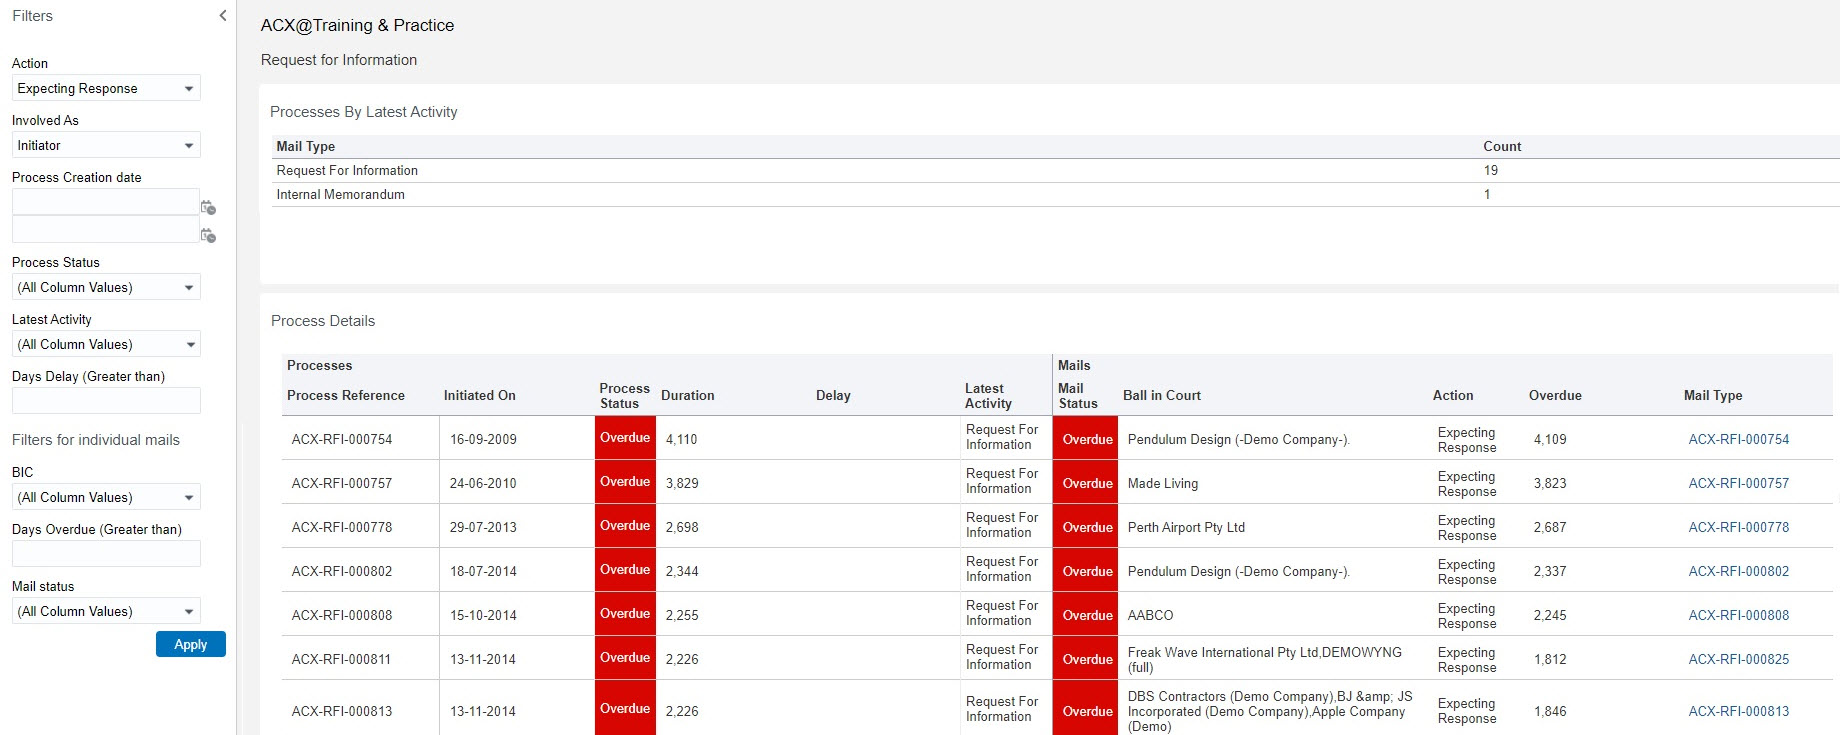
Clicking More Details displays information such as the Overdue days, Ball in court, Duration and other for each RFI processes.
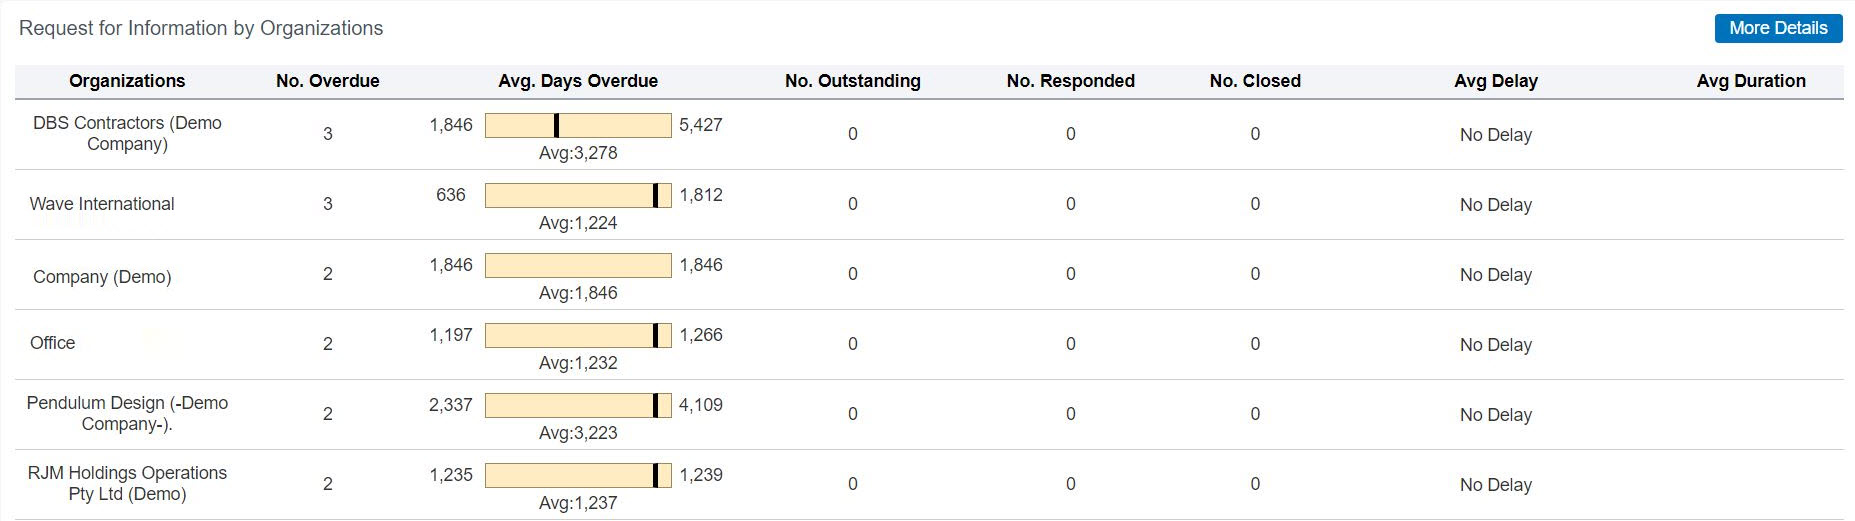
The bottom table shows us which organizations have not yet responded to the overdue RFI's.
Clicking More Details displays information such as the Overdue days for each process.