Support Central
Get easy-to-understand visualizations of process information to diagnose risks and performance.
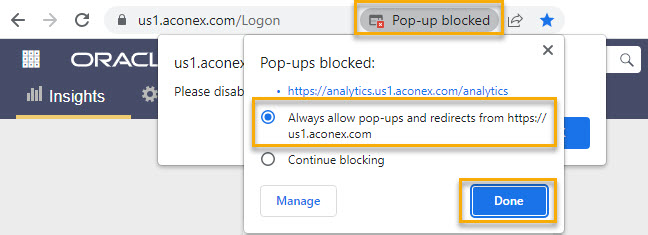
Unable to see all projects? See Why can't I see all my projects on the portfolio page? or How often is Dashboards data refreshed?

The following metric/attributes are visible:
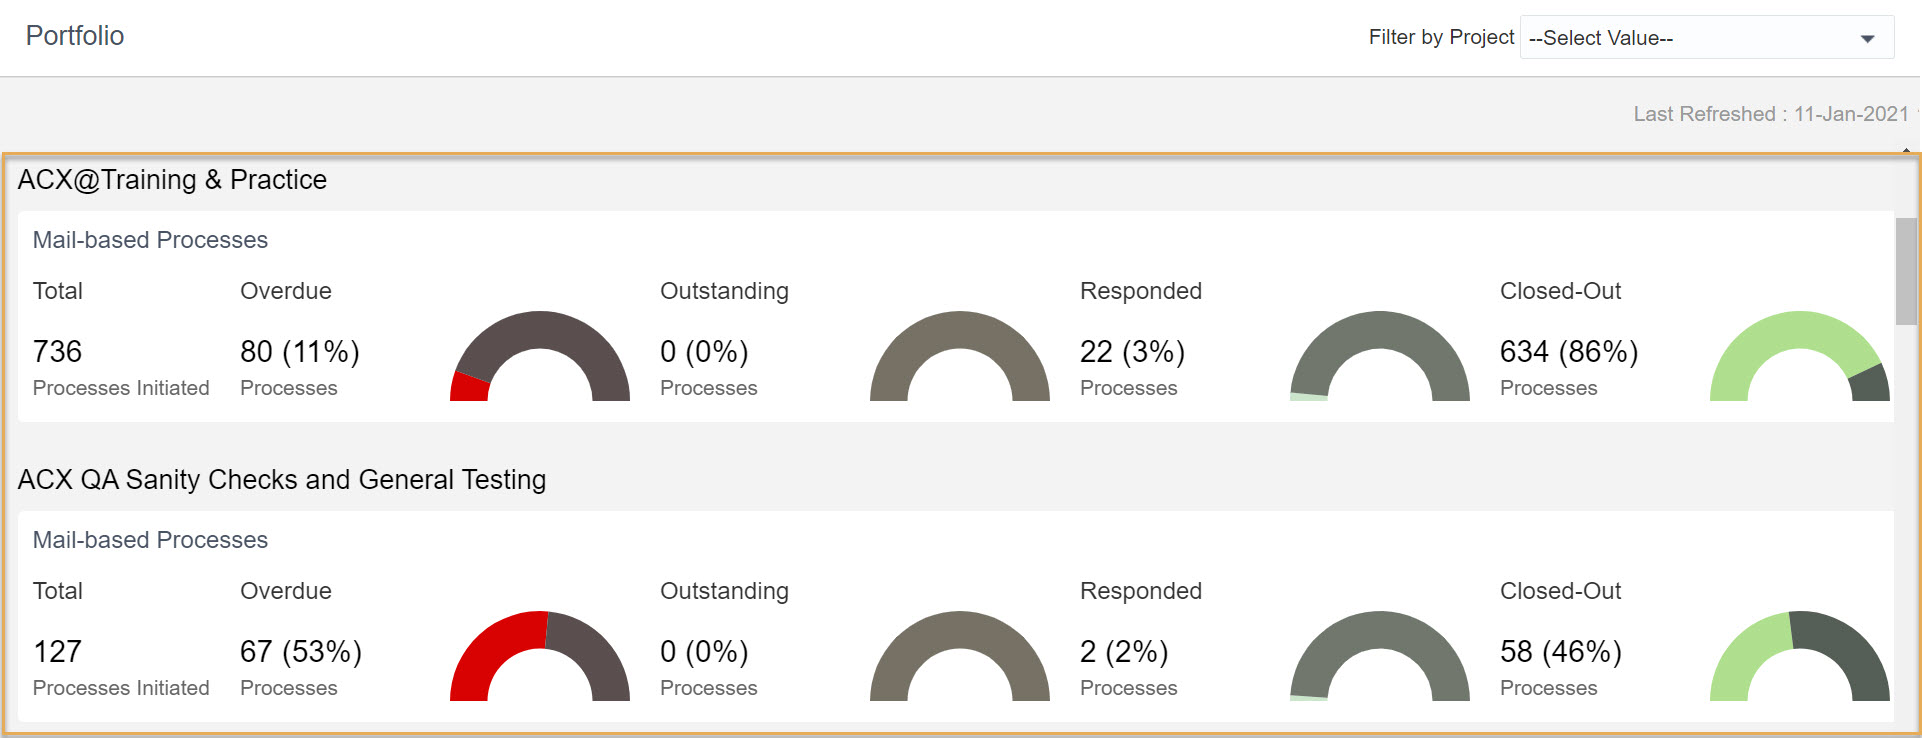
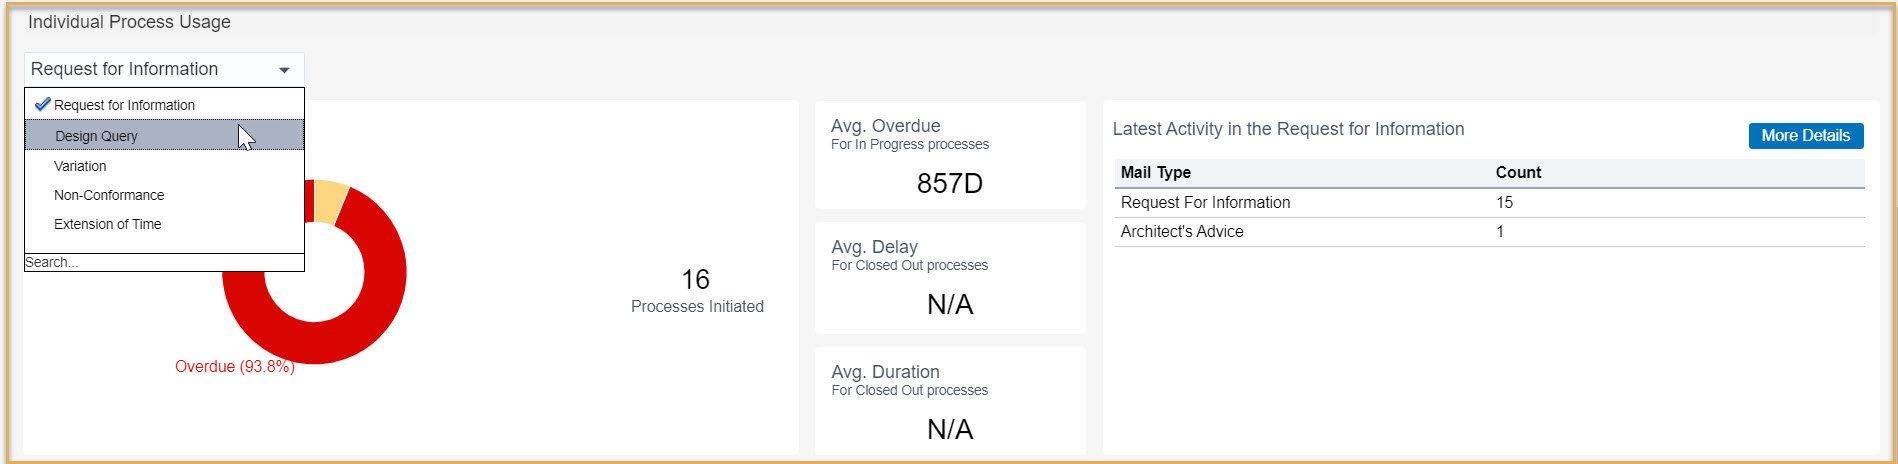
Total Processes: the total number of processes in the project, based on the configuration.
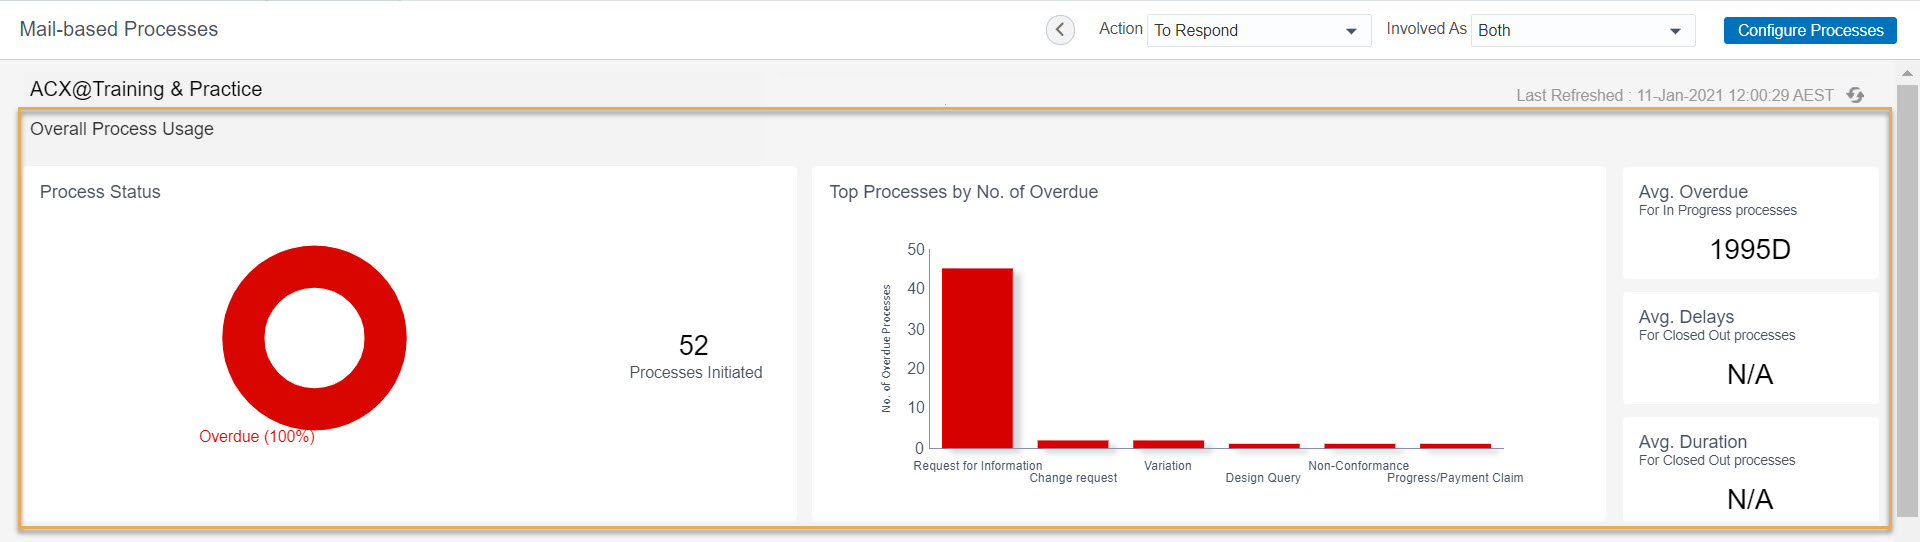
Process by status: (Overdue, Outstanding, Responded, Closed-Out). Each donut chart displays the number of processes by status, and its percentage. The status is determined by the most recent mail in the process that requires a response. If the process contains more than one response required mail, the highest priority status is used.
Top Processes By No. of Overdue: The number of overdue processes by process name, in descending order.
Avg. Overdue: Average of the overdue days for all overdue processes in the project. Calculated by the sum of all overdue days (for all overdue processes) divided by the total number of overdue processes.
Avg. Delay: Average of the delayed days for all closed out processes in the project. Calculated by the sum of all delayed days (for all closed out processes) divided by the total number of closed out processes.
Avg. Duration: Average duration of all closed out processes on the project. Calculated by the sum of duration for all closed out processes divided by the total number of closed out processes.
Latest Activity: Displays the top ten latest mail types in the selected process for the project. Counts the number of mails.
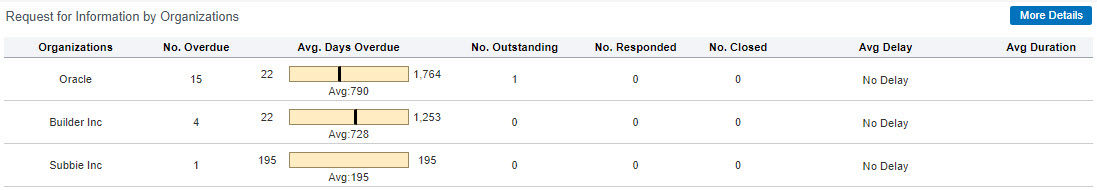
Process by Organization: Displays details for each organization involved in the selected process for the project.
Overdue: Number of overdue mails where the organization is in Ball in Court.
Avg. overdue: Min overdue, Max overdue, and weighted avg. of overdue days for all mails where the organization is in Ball in Court.
Responded: Number of responded mails where the organization is in Ball in Court.
Outstanding: Number of outstanding mails where the organization is in Ball in Court.
Closed: Number of processes closed.
Avg. delay: Min Delay, Max Delay, and weighted average of Delay days of for all the processes that were closed with a delay.
Avg. duration: Min duration, Max duration and weighted average of duration days of for all the processes that were closed with a delay.
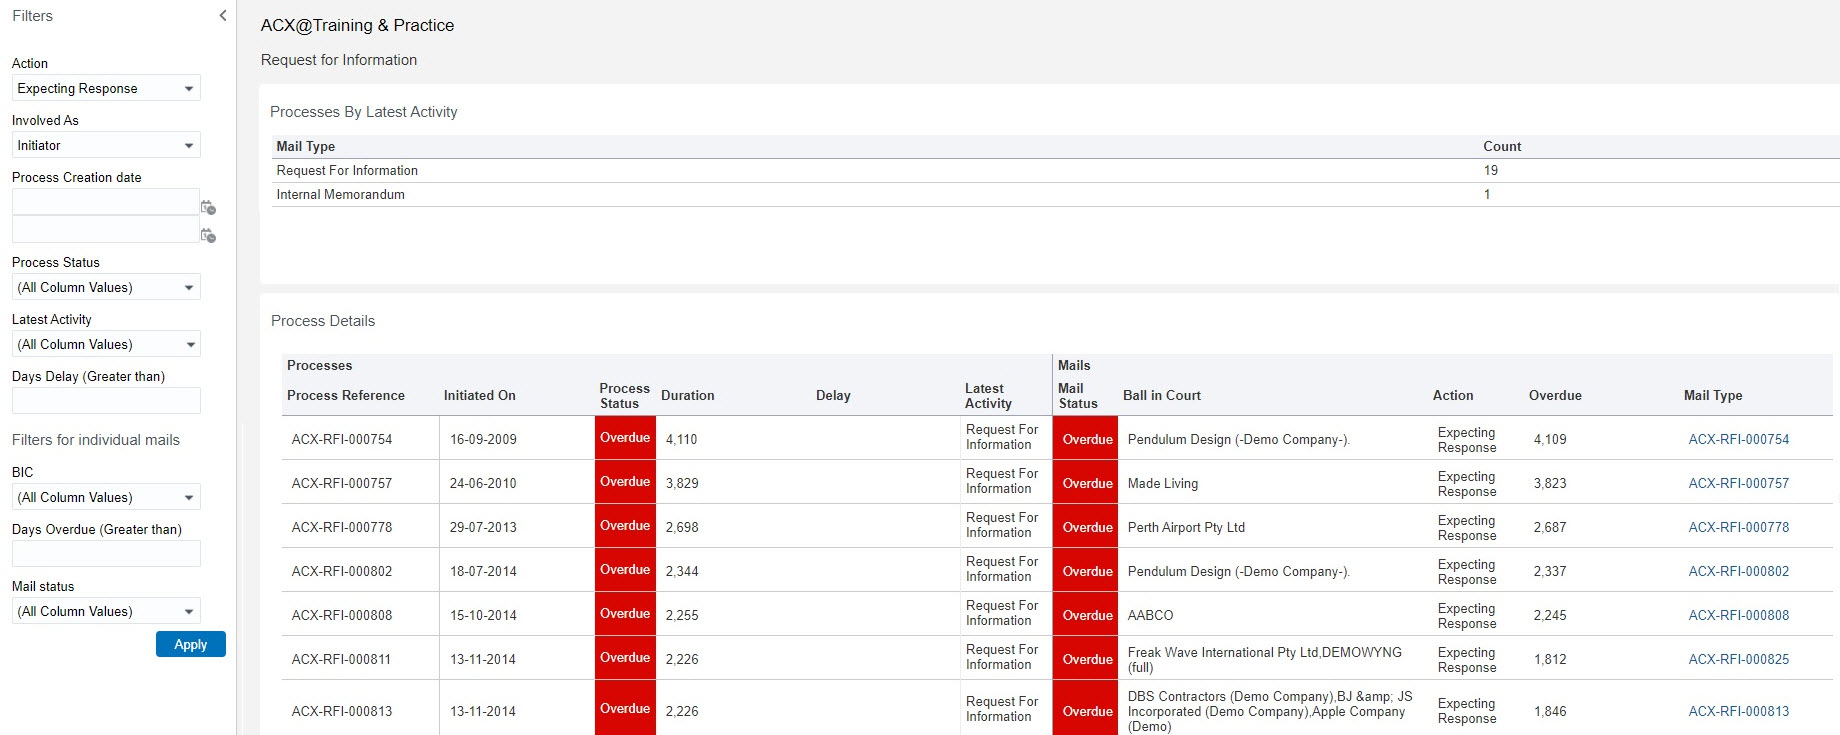
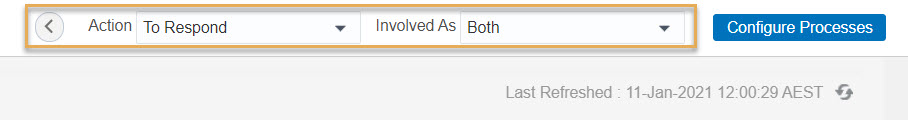
Process level filters:
Mail level filters:
Definitions of the filter attributes are same as the process attributes.
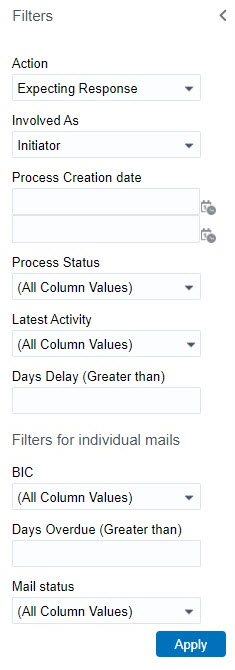
Make sure you click Apply after making any changes to the filtering.


