Open and view standard reports

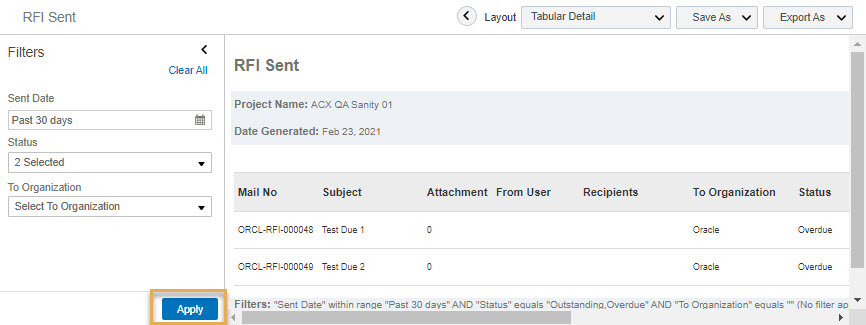
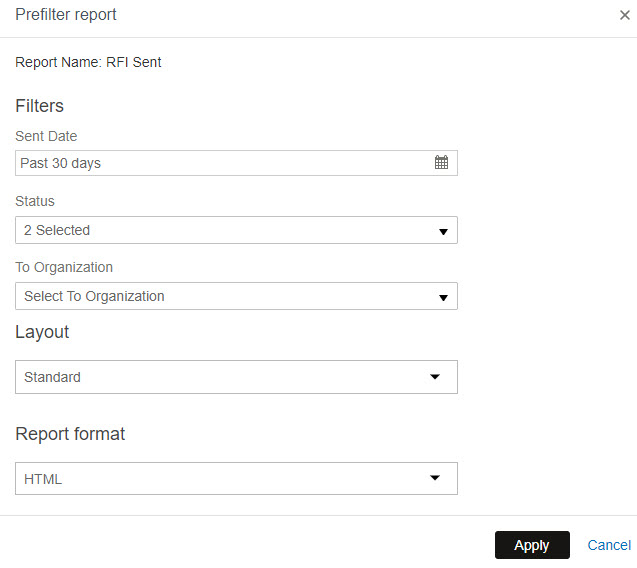
Run, save and share reports that use and show a variety of data.

Opening and running reports

  1. From the Insights module select Reports.


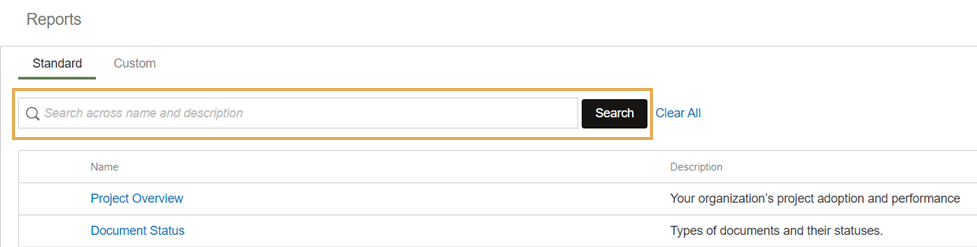
  1. You’ll see a table on the Standard tab listing the default reports along with a brief description of what they cover. The Custom tab lists any saved reports.

    You can search and filter the reports based on the report name and description.

  1. From the Standard tab, if you hover over a row, the three dots icon appears. If you click this you’ll see the following options: 
  • Prefilter and view report
  • View History
  1. From the Custom tab, if you click the three dots you’ll have the following options:
  • Prefilter and view Report
  • View History
  • Share
  • Edit Properties - change the name and description of a report.
  • Add/Edit Layout
  • Edit Data Model
  • Export to XML
  • Import Layout
  • Delete Report
  1. To open a report, select Prefilter and View Report. You can also open it by clicking its name.

    Select your filters as required and click OK to run the report. Prefiltering will help your report to load faster and ensures you only see the data you need. You can also select a layout and format HTML, PDF, XLSX and CSV to view. 

Tip!

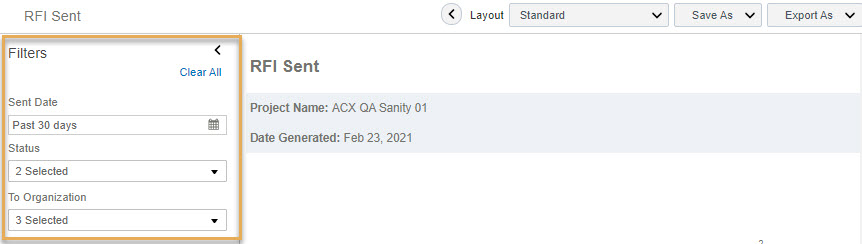
Large reports may take some time to load. After 30 seconds you’ll be given the option to wait or go back to the report listing page while your report generates in the background. Once the report is ready you can view it from the Report Run History panel.

  1. Using the filters on the left you can change the data used in the report. In this example, these are Date Range and Status

    When you do this, you have to press Apply to re-generate the report and see the updated data.